

vs Excel & Sheets
The last-mile grind
The data's the easy part. Making it presentable is where the afternoon goes, then next week you rebuild the same chart from scratch.
Gallery
The problem
The numbers are done. The chart still looks like a spreadsheet, and the afternoon disappears into nudging bars and matching brand colours from memory.
vs Excel & Sheets
The data's the easy part. Making it presentable is where the afternoon goes, then next week you rebuild the same chart from scratch.

vs Canva
Fine until your data needs to tell a specific story. Then the layout fights you, and you're back to arranging shapes by hand.

vs AI chart generators
A rough first draft, never something you'd put your name on. And when the emphasis is off, there's nothing to click and fix.
How it works
Paste from Sheets or Excel, or upload a CSV. No connectors to configure, no formatting to undo, the data just lands.
Opinionated defaults do the design work up front, sensible scales, clean type, one accent where it matters. It looks considered before you touch a thing.
Click any element, a bar, a label, a legend, and adjust just that. Then export a clean PNG sized for your deck and paste it in unedited.
Under two minutes from raw numbers to something worth sharing.
Chart types
Why Lightchart

Click a single bar to recolour it. Annotate one point. Restyle one label. The control that used to mean Illustrator, without the skill.
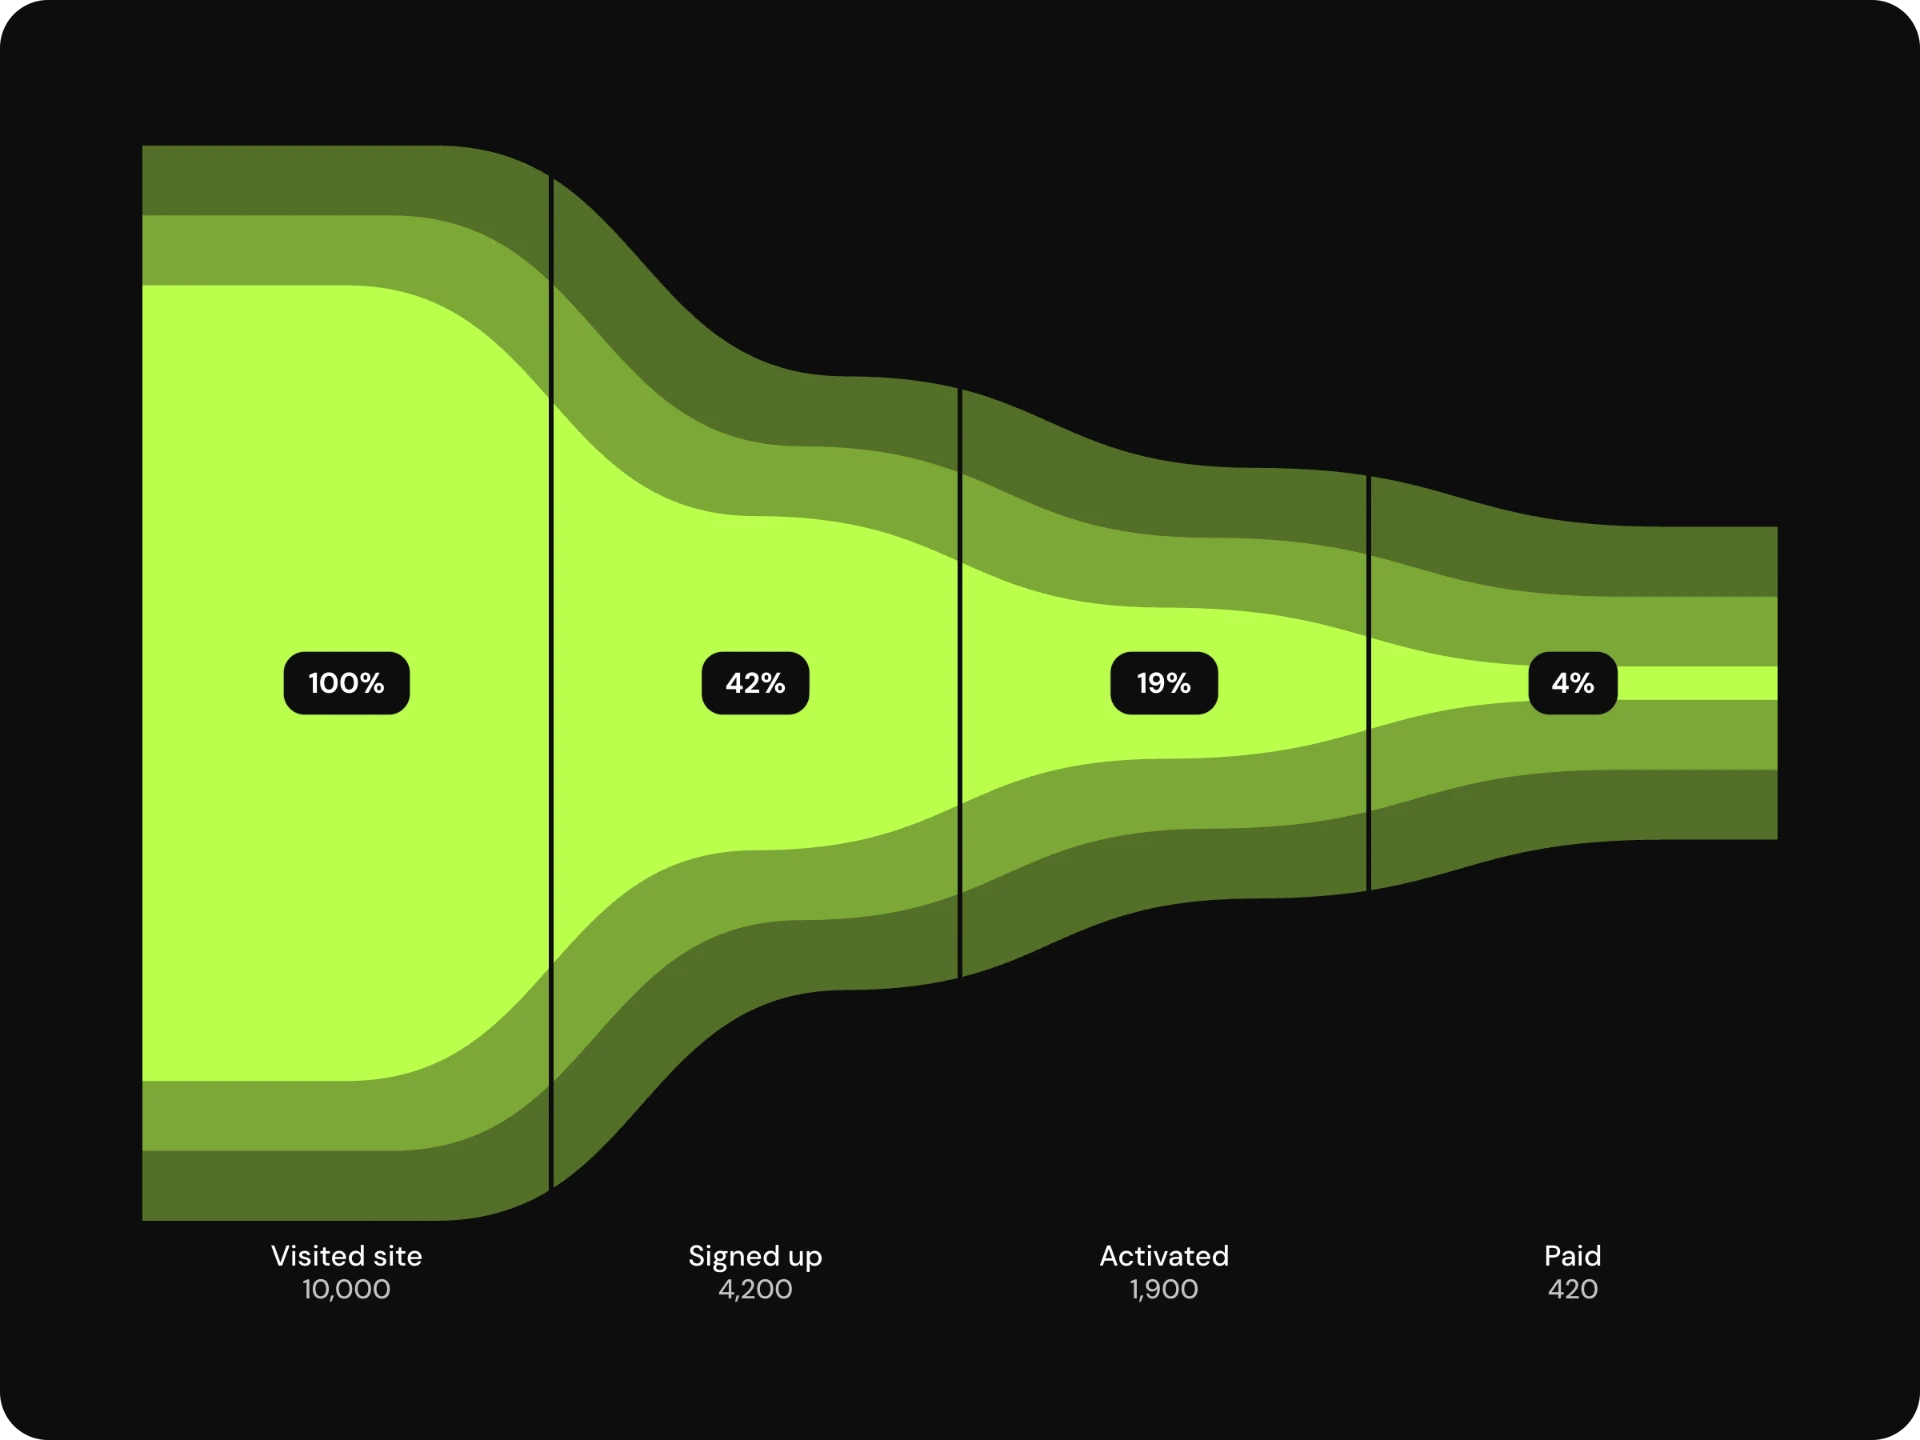
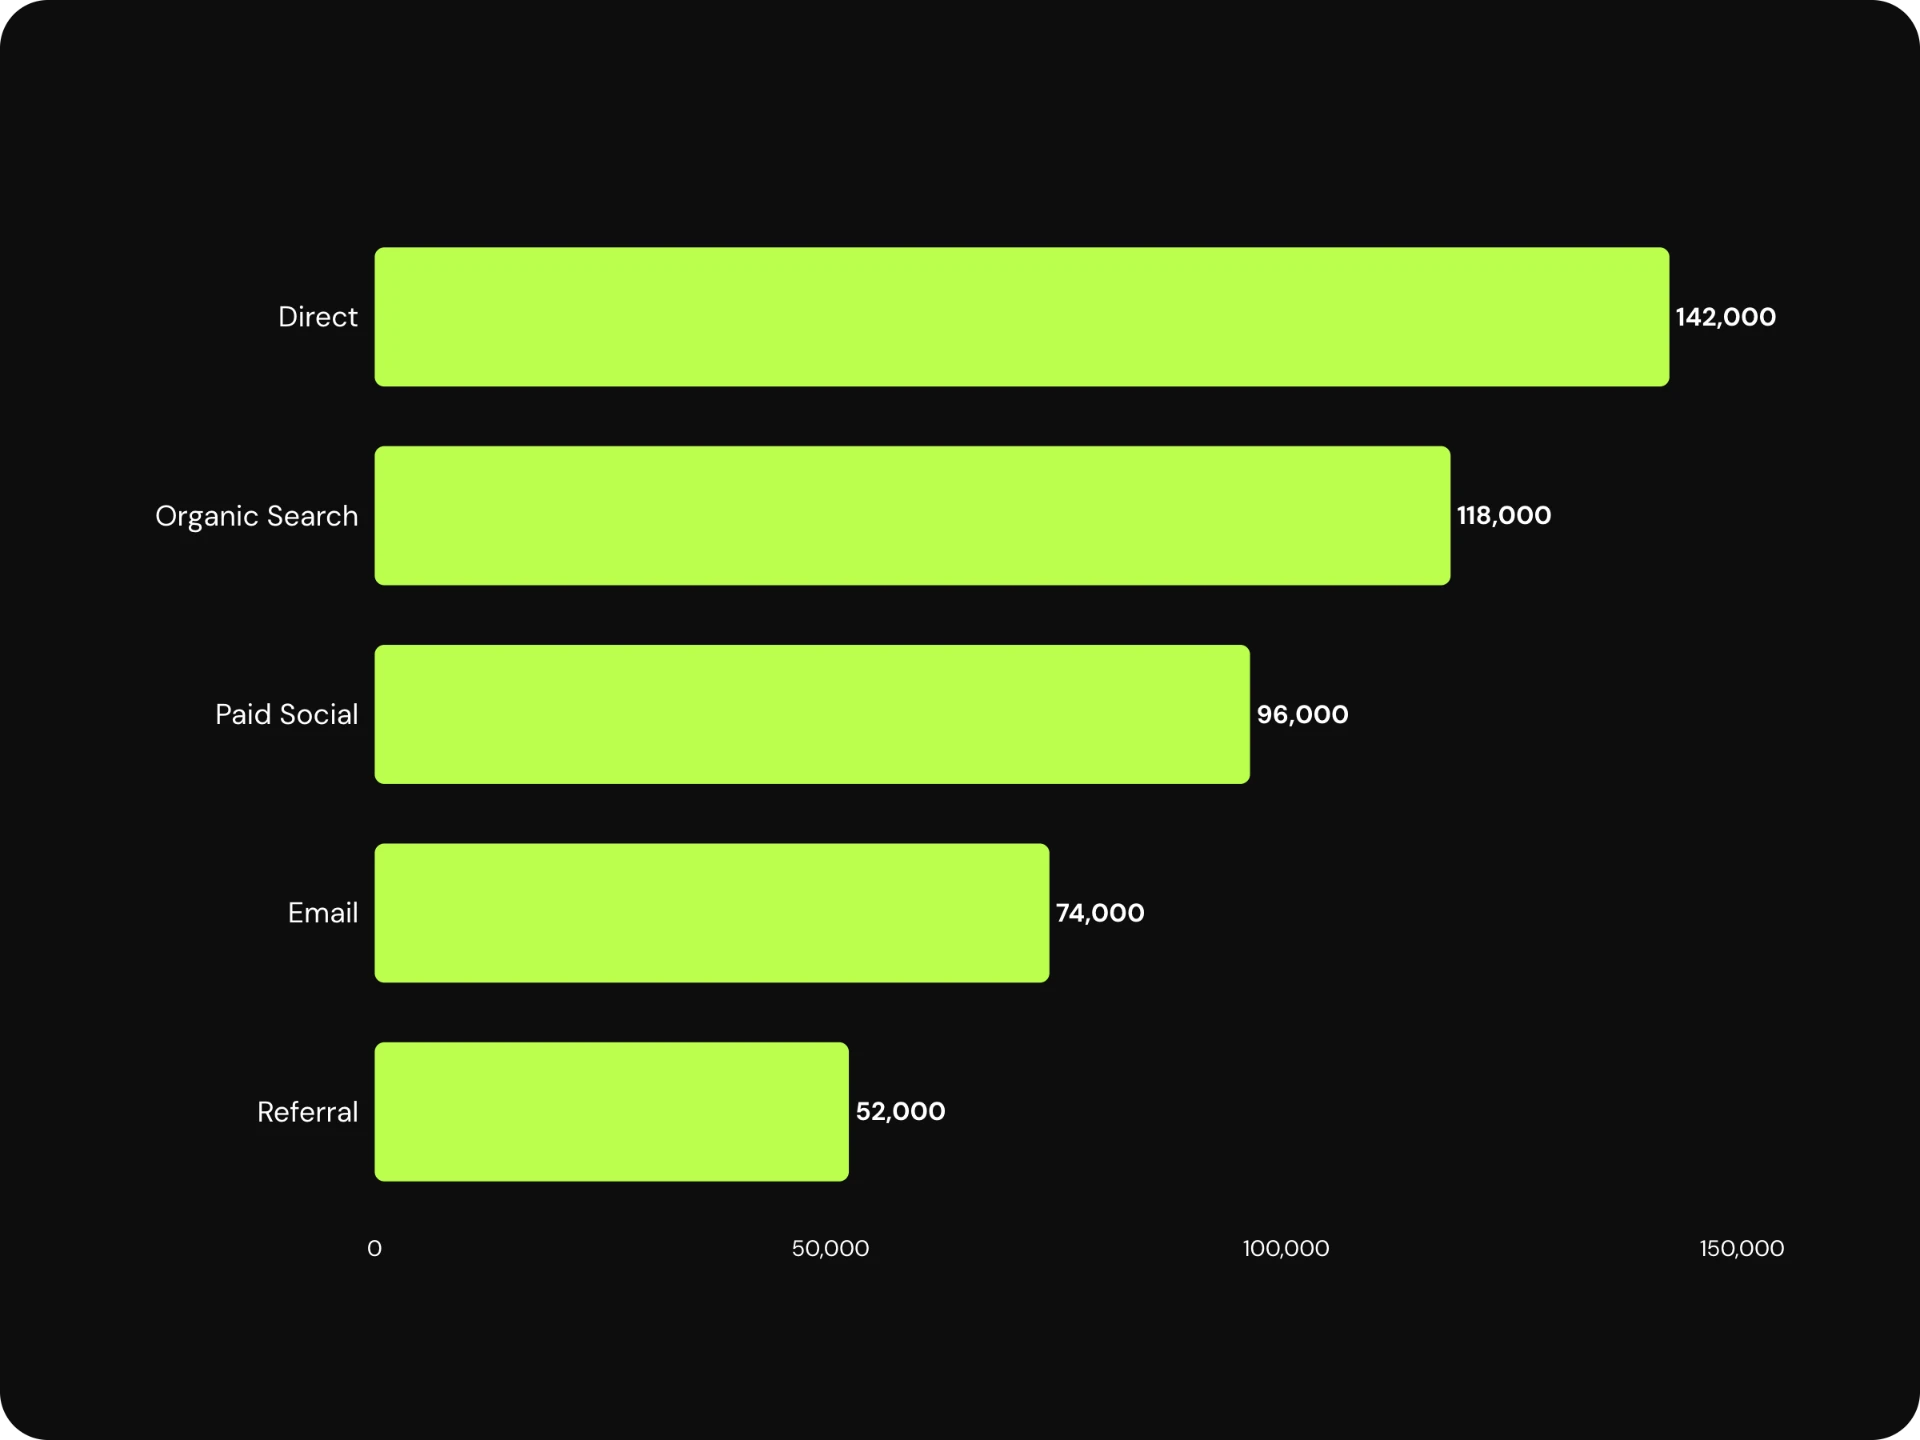
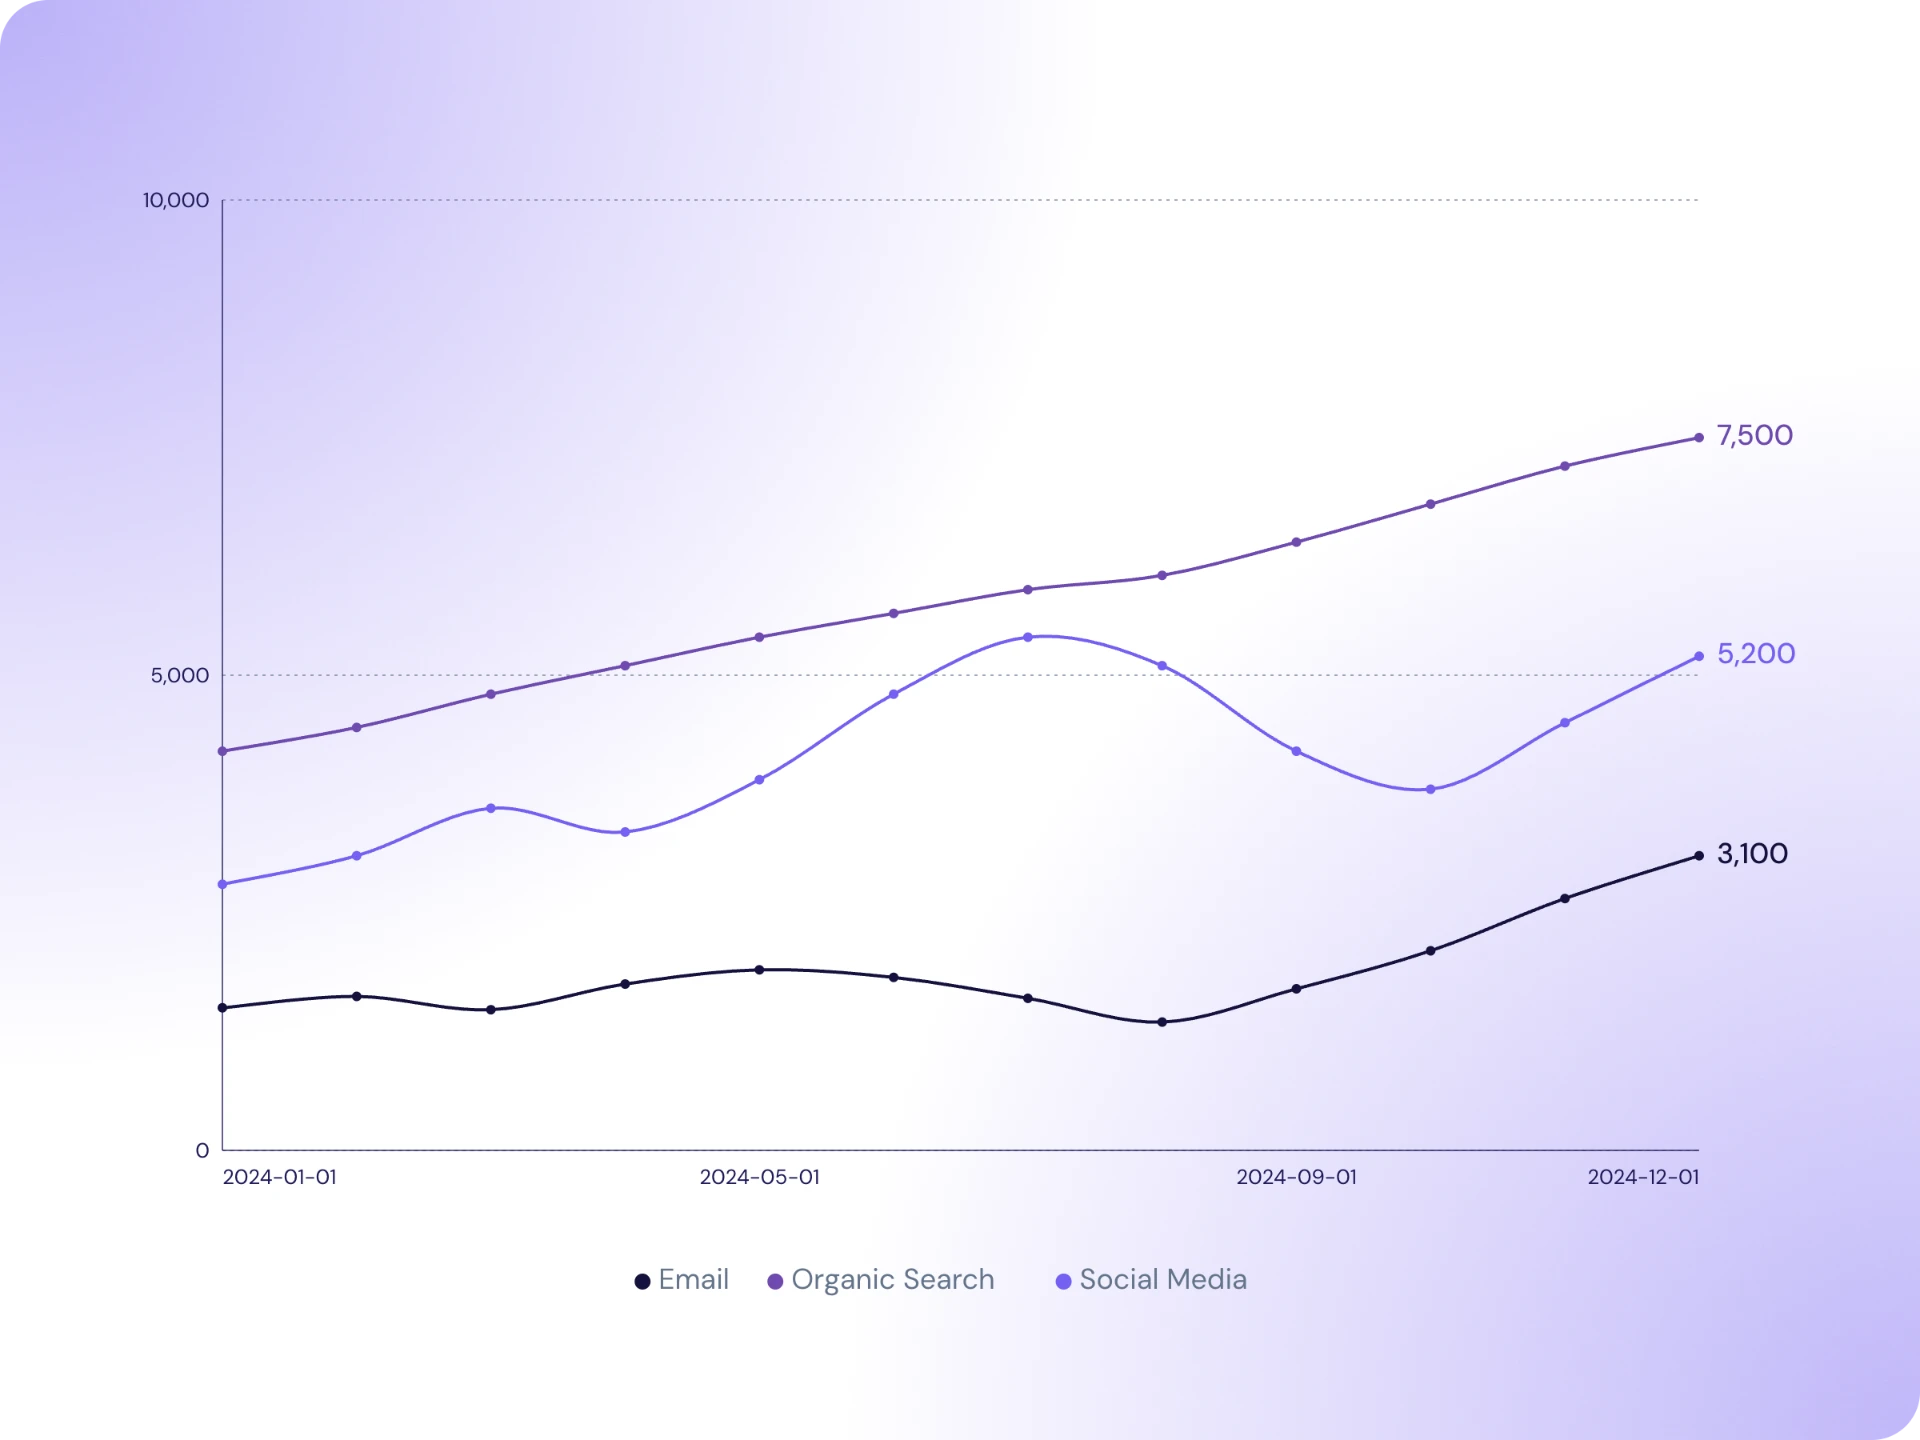
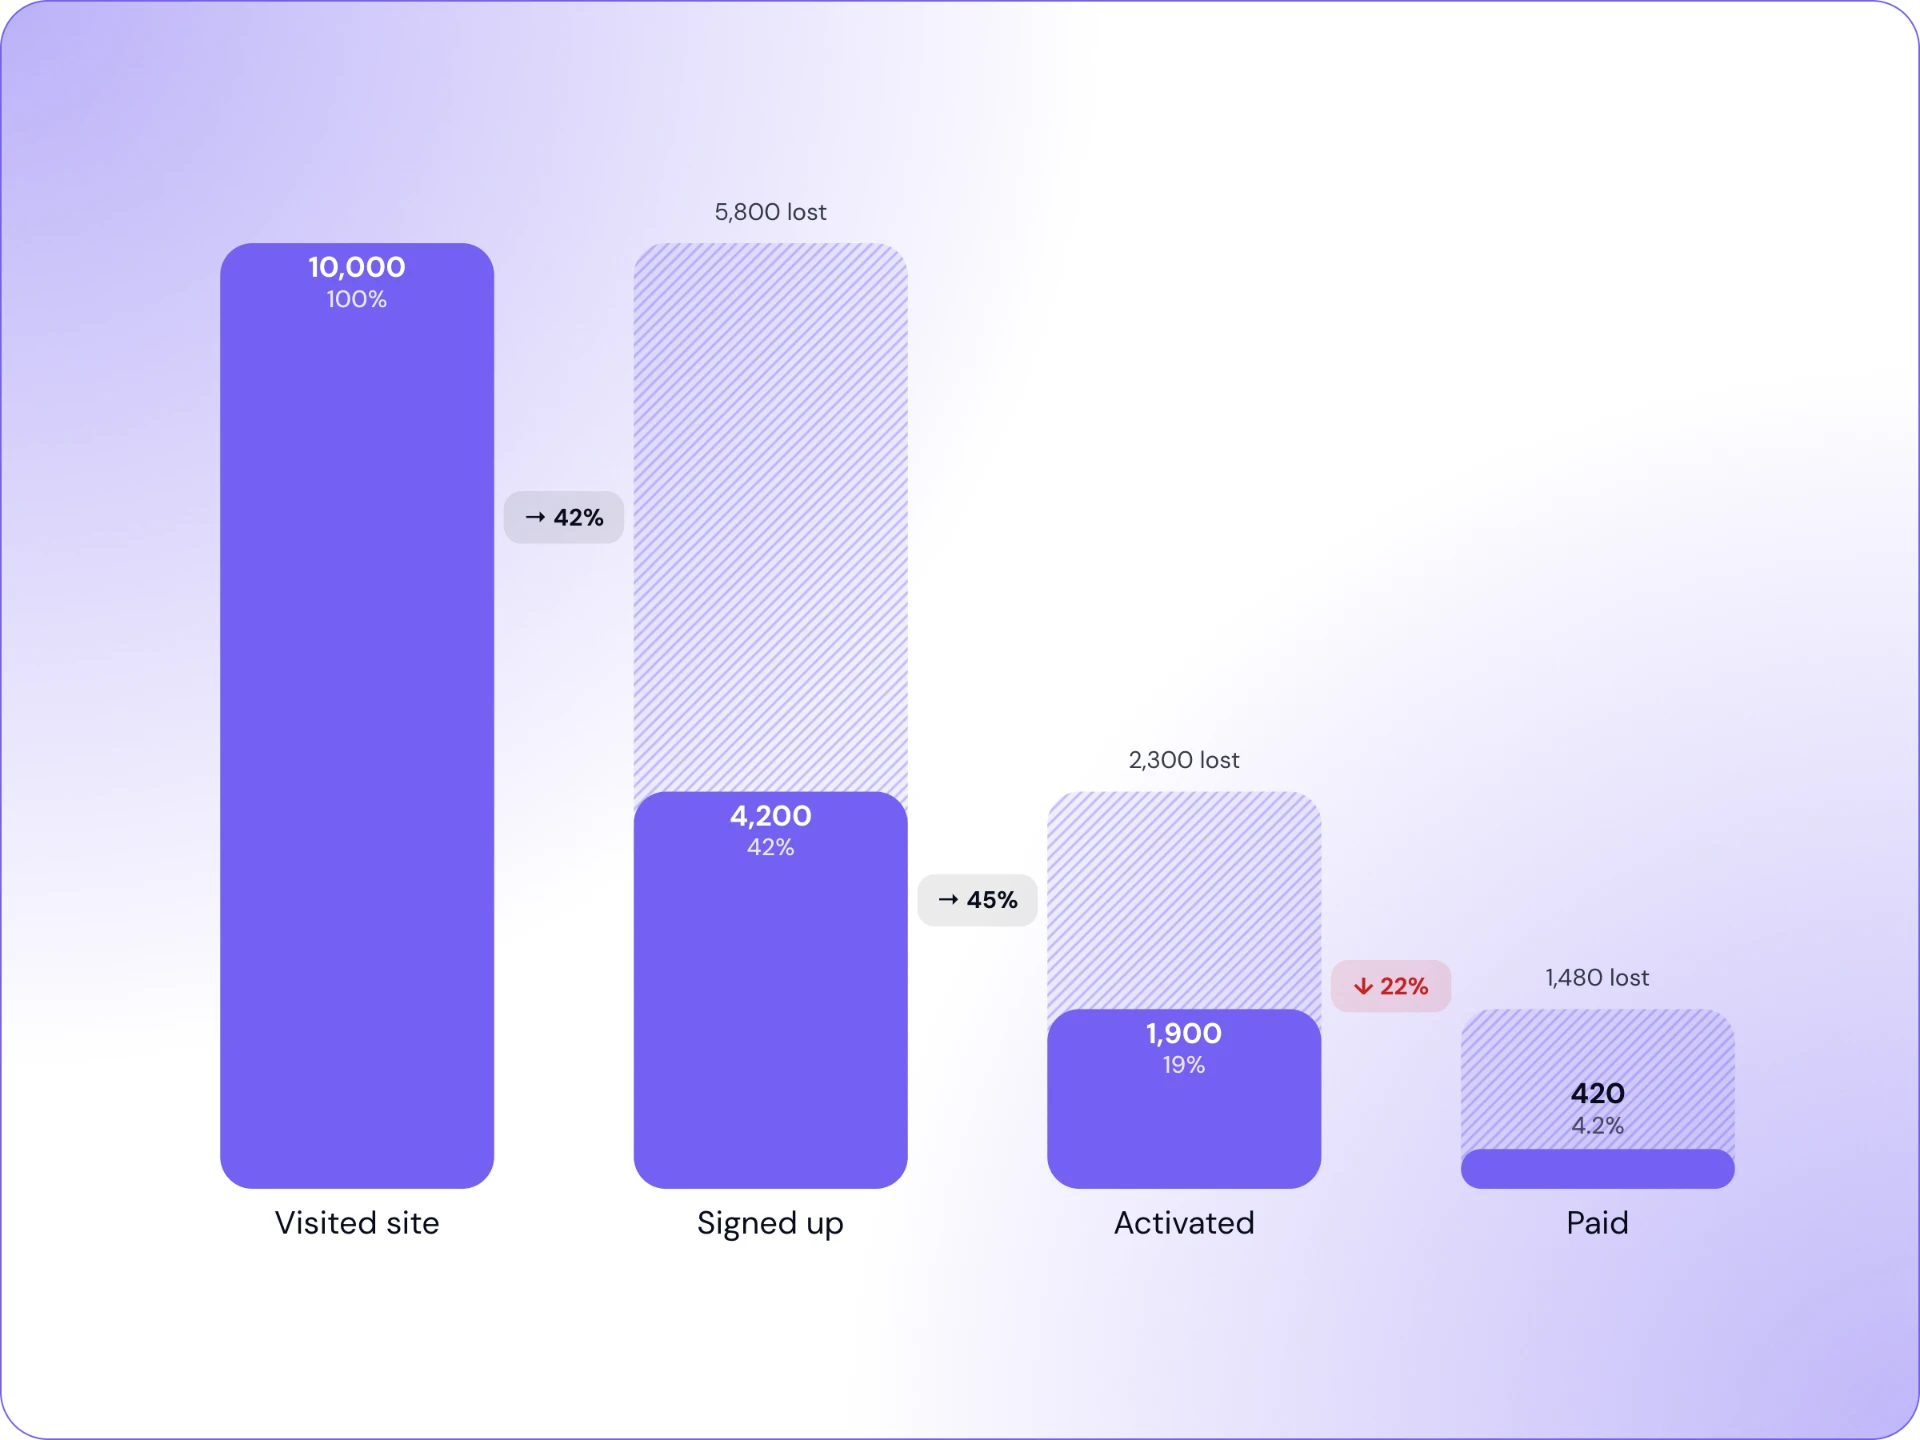
Learn more about sub-component editingModern bar, line, scatter, pie, donut, Sankey, funnel and sparkline charts, including grouped and stacked multi-series views for richer comparisons.
Learn more about chart types
Save your palette once. Every chart comes out on brand, no more matching colours from memory.
Learn more about brand colors & themes
Save your building blocks, KPI tiles, metric cards, annotated layouts, once, and drop them into any report. Build it once; reuse it forever.
Learn more about reusable componentsWeekly numbers are in
Export a clean, high-resolution PNG without editor controls, ready to place into presentations and documents.
Learn more about export for decksNo credit card. Free while in beta.
Compare
Different tools, different jobs. Here’s where each one stands for the last-mile chart problem.
| Dimension | Lightchart | Excel / Sheets | Canva | Datawrapper |
|---|---|---|---|---|
| Output quality | Designed defaults, polished before you touch anything | Visually weak default styling | Prettier than spreadsheets, but template-flavoured | Clean editorial look |
| Data-native input | Built around pasted spreadsheet data | Native, the data is already there | Manual entry into a template | Data-native paste and import |
| Sub-component editing | Click any bar, label, or legend and change just that | Limited; long menus for simple changes | Locked to the template’s layout | Element control within preset structures |
| Brand control | Persistent palettes and themes on every chart | Manual reformatting each time | Brand kit, but charts drift from it | Themes geared to web embeds |
| Export to decks | High-res PNG, sized and cropped for slides | Low-res screenshots | Geared to print and social, not slides | Built for web embeds, not PNG-to-deck |
No. Lightchart is built for non-designers. Opinionated defaults handle scales, spacing, type, and color before you touch anything, so the chart looks considered the moment your data lands. If you want to adjust something, you click the exact element, a bar, a label, a legend, and change just that.
Paste your data straight from Excel, Google Sheets, or a CSV into Lightchart. You get a chart with designed defaults instead of spreadsheet styling, and you can refine any element before exporting a clean PNG that drops straight into your deck or report.
Yes. You can set your palette and themes once, so every chart you make comes out on brand, no eyedropping hex codes or matching colors from memory each week.
Bar charts (vertical, horizontal, grouped and stacked), line graphs, scatter plots, pie and donut charts, Sankey diagrams, funnel charts, sparklines, KPI cards and data tables. You can also combine several charts on one card and export them as a single image.
Lightchart exports high-resolution PNGs sized for where the chart is going, a 16:9 slide, a document, Slack, or LinkedIn. The export is clean and final, so you can paste it in unedited.
Canva is a design tool with charts bolted on, great for graphics, but the chart layouts are templates that fall apart when your data needs to tell a specific story. Lightchart is data-first: paste real numbers, get a real chart, and edit it at the element level without any design skill.
Yes. Lightchart is free while in beta, with no credit card and no trial countdown. We'll let you know well before anything changes.